1,000-year Flood Study & Modeling
The Milwaukee Metropolitan Sewerage District (MMSD) collects and reclaims wastewater from 28 communities and provides flood management for the greater Milwaukee area. MMSD wanted to help communities identify areas prone to flooding during extremely large storm events and plan for future infrastructure improvements to protect residents and boost community resilience.

To achieve this goal, MMSD partnered with MSA and commissioned a study for Milwaukee County focused on the 1,000-year flood event. The goal was to understand how a catastrophic storm could impact the communities it serves. With extreme rainfall events increasing in frequency and intensity, MMSD sought a proactive, data‑driven approach to identify flood‑vulnerable areas, guide resilient infrastructure planning, and protect residents across all 238 square miles of the county.
Due to the project’s massive scope and comparatively limited budget, MSA, by necessity, developed an innovative, streamlined approach to complete the work. MSA’s approach to Phase 1 of the project employed high-level 2D rain-on-grid modeling utilizing high-resolution LiDAR topographic mapping and available GIS data describing major components of drainage infrastructure to predict the magnitude of flooding on a HUC12 watershed basis. The results from adjacent HUC12s were stitched together across the entire county and used to assess flooding from upland (non-riverine) sources. To understand which portions of the county would be most vulnerable to flooding, MSA and MMSD developed a three-tier prioritization framework:
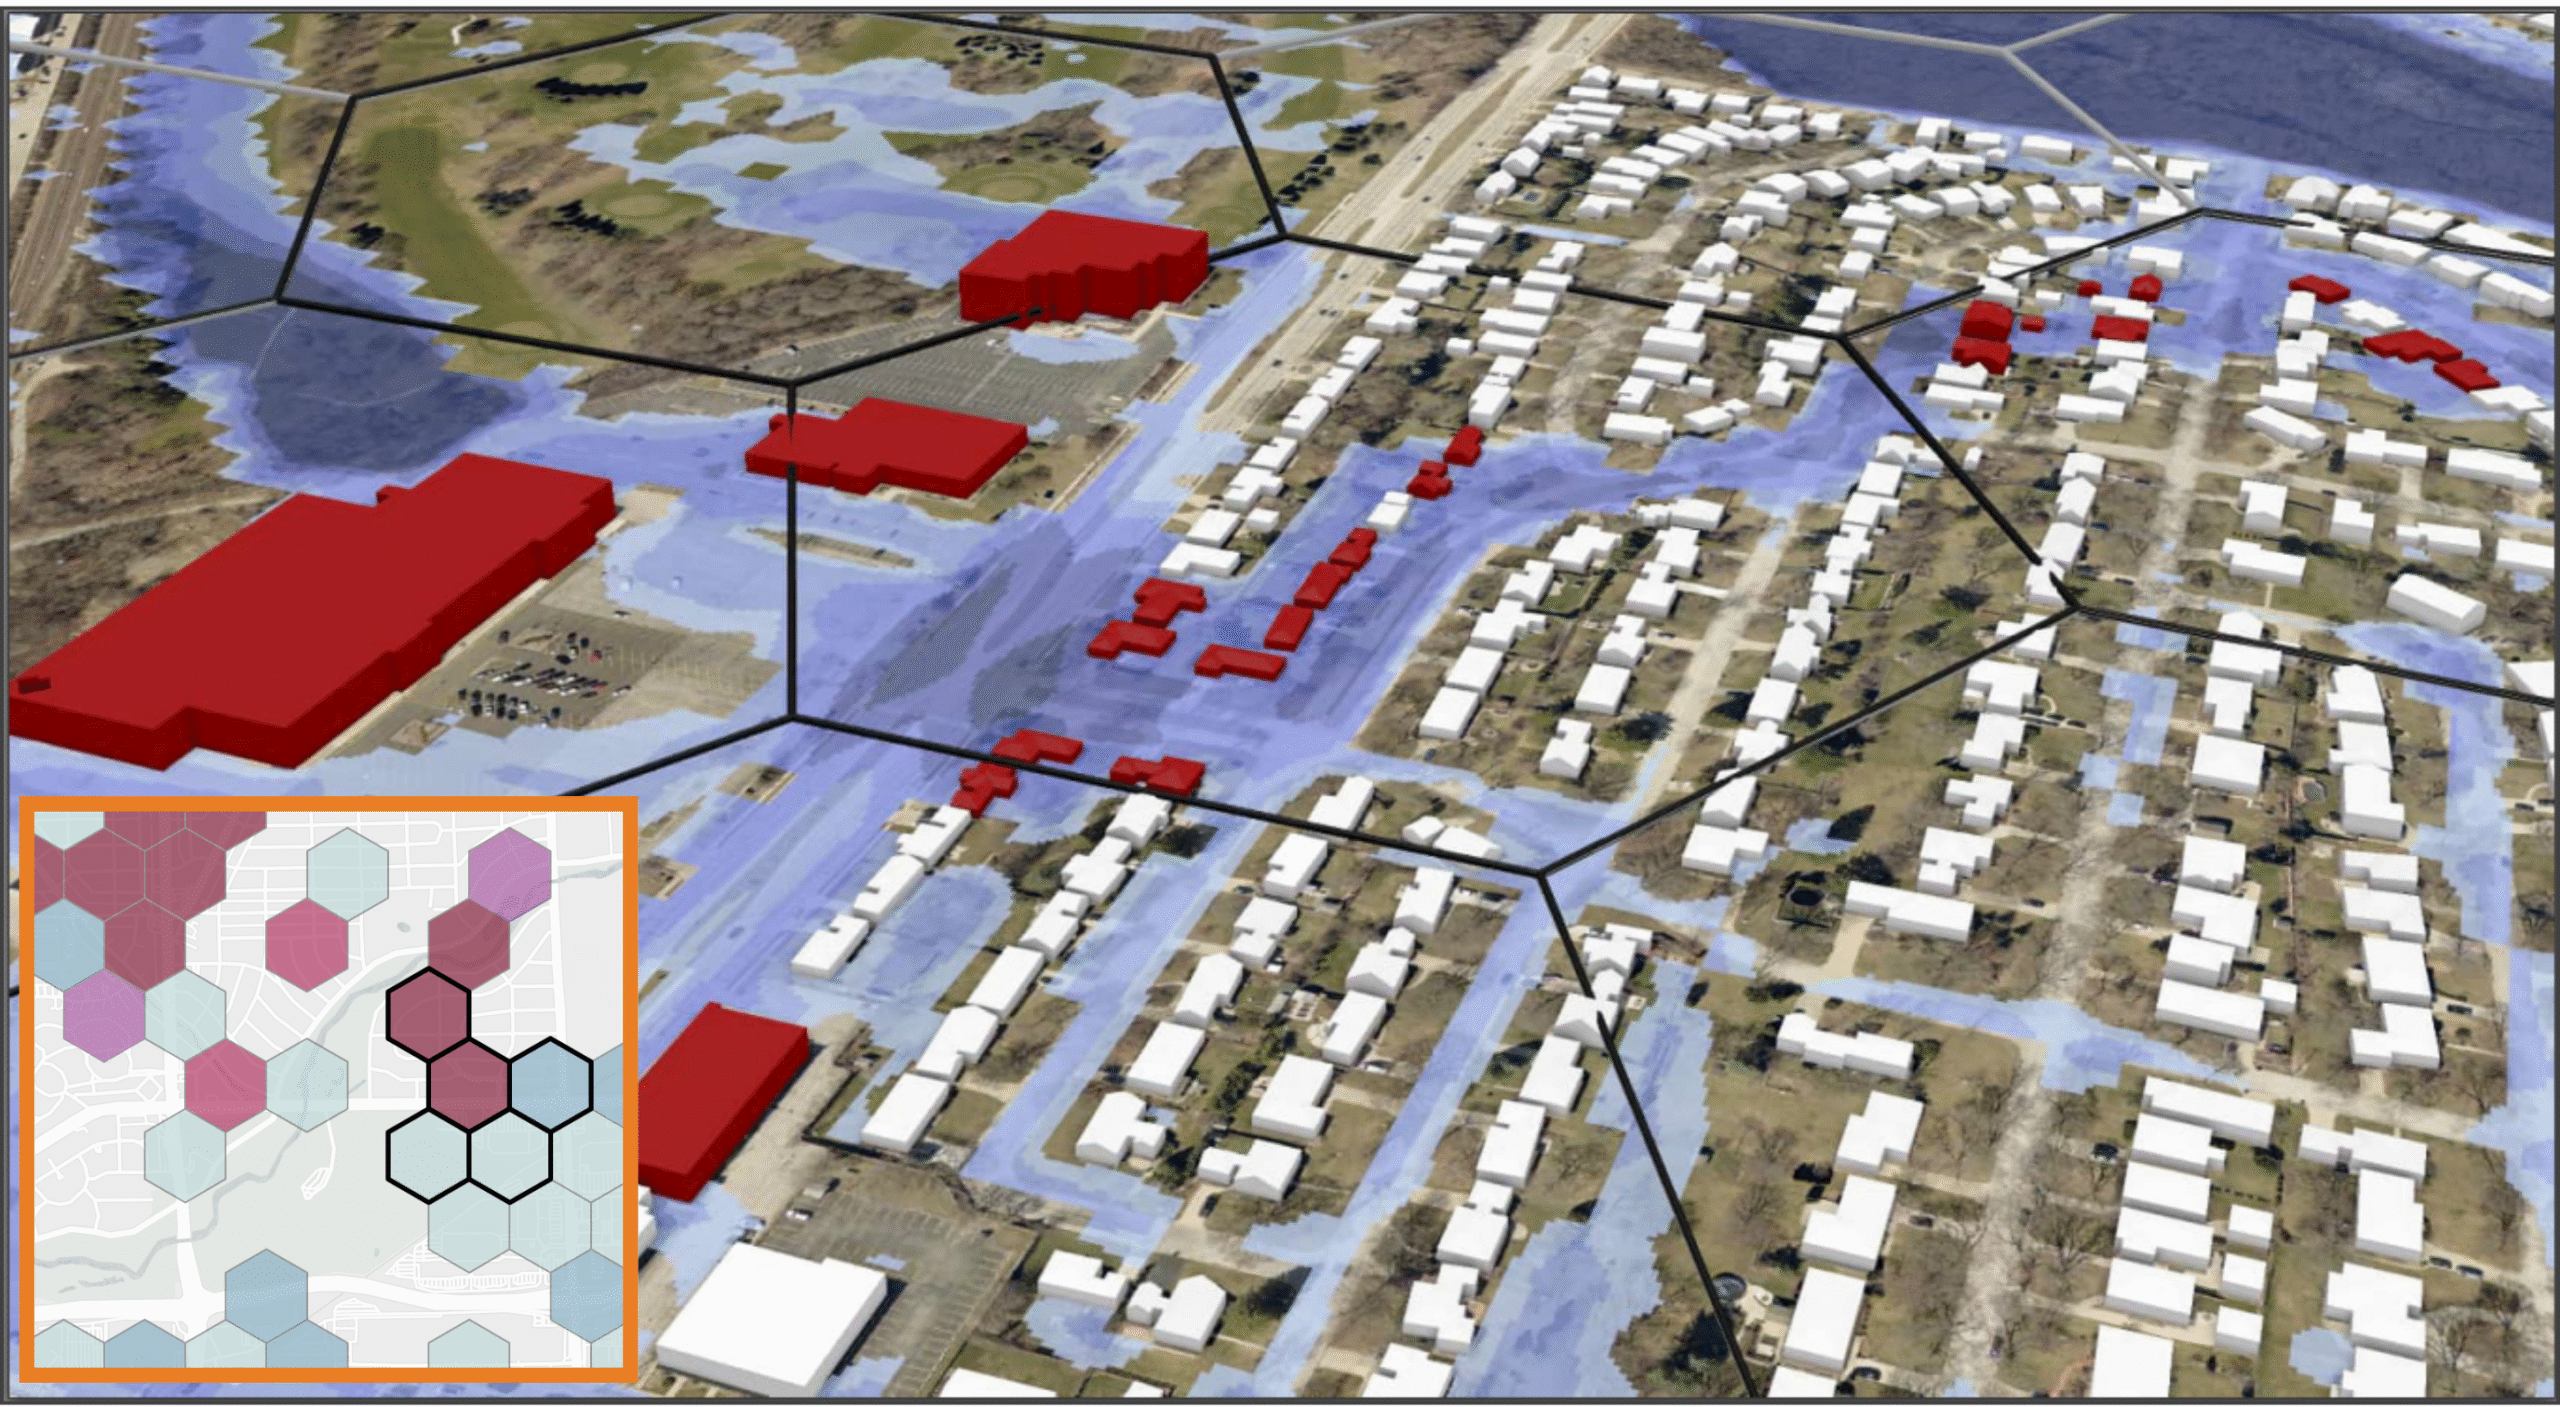
Impacted Buildings and Roads: Any building footprint that touched 1 foot of water was flagged. Roadways were broken into uniform lengths, and any street with more than 1 foot of water at the centerline was also flagged.
Flooding Source: MMSD has excellent modeling for riverine flooding. This study wanted to focus on the upland areas; therefore, any flooding within a mapped river floodplain was masked and not considered for this analysis.
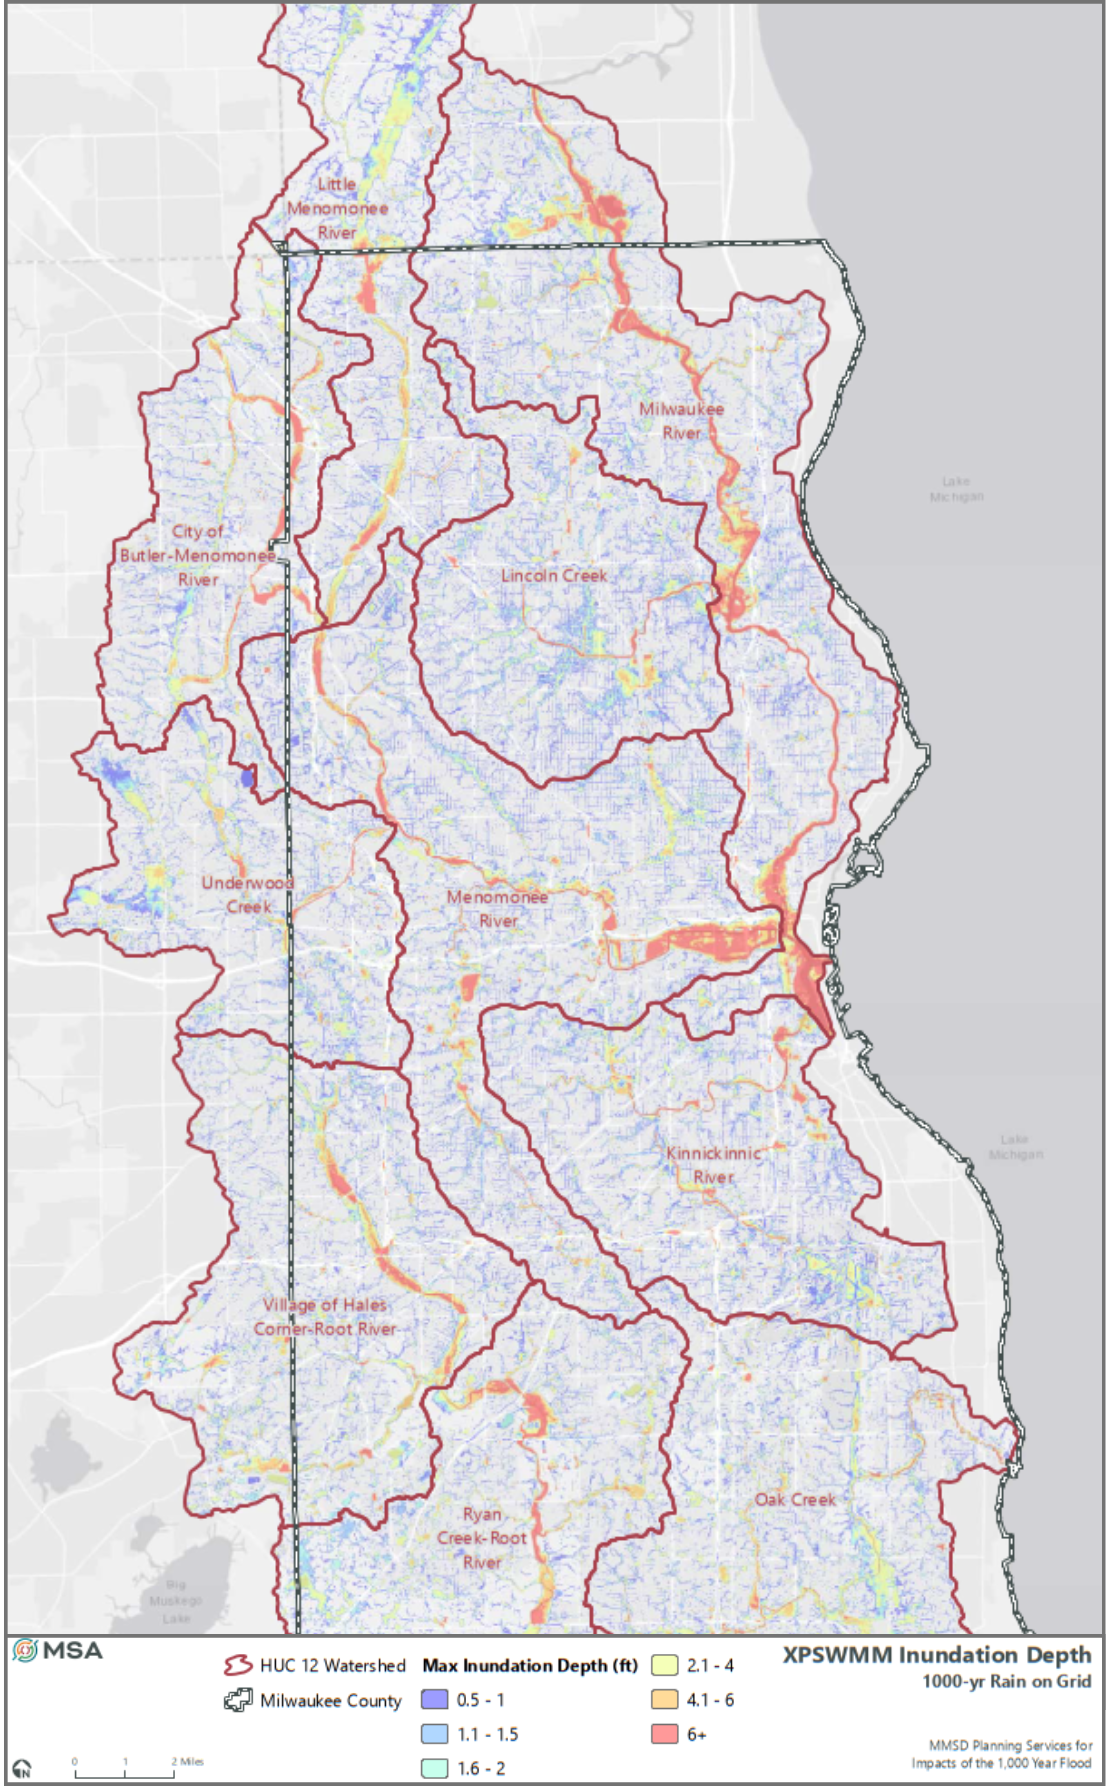
Socioeconomic Factors: Social Vulnerability refers to the resilience of communities when confronted by external stresses, like a very large flood event. The U.S. Census Bureau has a mapped Social Vulnerability Index (SVI) which was overlaid on the results to identify regions of the study area that might be underserved.
The resulting countywide maps provided a clear visual guide to identify “hot spots” deserving more detailed analysis. Representatives from the communities within the study reviewed the Phase 1 results and identified areas to study in more detail (Phase 2).
For Phase 2 of the project, constituent municipalities were asked to review Phase 1 results and identify areas of particular interest to them. MSA constructed high‑detail 1D/2D hydrologic and hydraulic models of these targeted areas in PCSWMM and XPSWMM that integrated the mapped impervious areas and extensive storm sewer networks. The modeling outputs provided better resolution that can be used to support redevelopment, infrastructure upgrades, and a reference benchmark for extrapolating detailed insights to areas not included in this phase. These models now serve as critical decision-making tools for communities aiming to strengthen flood resilience amid a changing climate.
MSA’s innovative modeling approach, combined with MMSD’s collaborative leadership, enabled a cost-effective, countywide assessment that distilled vast data into actionable insights. MSA was recently authorized to conduct a third phase of the project which will use modeling completed in Phase 1 to simulate a near-1,000-year flood event Milwaukee experienced in August 2025 to further refine regional resilience strategies.
Together, MMSD and MSA are equipping Milwaukee County with a clearer understanding of where the greatest flood vulnerabilities lie — and providing communities with the tools they need to plan smarter, protect people and property, and build long-term climate resilience.
Client
Milwaukee Metropolitan Sewerage District
Location
Milwaukee, WI
Services Provided
Contact Project Lead

Eric J. Thompson, PE
Senior Team Leader
Related Projects
Greentree/McKenna Watershed Study
Watershed study & 2D XP-SWMM model identify flood risks and mitigation opportunities in the City of Madison.
MoreHawks Landing Flood Reduction Study and Design
MSA was hired by the City of Madison to complete a flood study in order to determine the cause of recurrent flooding within a relatively recently constructed residential subdivision on the City’s far-west side. This neighborhood was less than 20-years old at the time MSA was hired, and while the tools available for the original development were not as sophisticated as those available today, they certainly had the ability to prevent the spectacular flooding that this neighborhood experiences — but regrettably, did not.

Images taken by residents during flooding events the neighborhood experienced during the course of this project.
Before we could evaluate potential solutions to the flooding problem, MSA needed to thoroughly investigate the potential causes. Our investigation began with a forensic review of the original designer’s calculations for the stormwater management system. Given the frequency and severity of the flooding being experienced, we were surprised to find that the original site designer had, indeed, completed their work to the standard of care expected at the time.
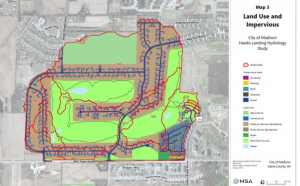
GIS map showing land and impervious areas within the 305-acre study area.
However, as we dug deeper, we discovered some significant items beyond the control of the designer that contribute substantially to the flooding problem. Of greatest significance was the publication of a new hydrologic atlas which increased the estimated 100-year rainfall depth from 6.00 inches to 6.66 inches. Coming in at a close second was a near wholesale reclassification of soils within the watershed from HSG B to HSG C, which resulted in a substantially higher runoff coefficient for the watershed. Of lesser importance, but still notable, were inconsistencies between how proposed detention ponds were constructed relative to how they were designed, and the addition of approximately 30 acres of watershed area due to storm sewer extension projects. Collectively, these issues caused a 45% increase in estimated runoff rates and a 35% reduction in intended flood storage. The drainage and stormwater management system were undersized.

GIS map showing peak depths anticipated to occur in one part of the watershed under 100-year flood conditions. Each color gradation represents an increment of 6″ of flood depth, with red areas indicating over 2.5′ of flooding.
In order to understand the magnitude of the effects of these changes in runoff conditions, MSA prepared a 2D SWMM model of the 354-acre drainage area tributary to the problem area. The model was constructed by combining data from the following sources: construction plans for three developments within the watershed, aerial photos and contour mapping, infrastructure mapping provided by the City, extensive topographic survey collected by MSA surveyors, and visual observations taken by MSA engineers.
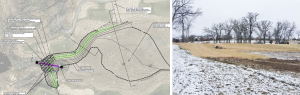
Plans for a new detention pond constructed in 2018 and an image of the pond after construction.
MSA worked with City of Madison staff to identify three principal improvements that will provide 100-year flood protection to the existing residences. These improvements consist of four separate phases and include a combination of increased flood storage in the upper portions of the watershed and increased drainage capacity in the lower portion of the watershed. System improvements have been completed in multiple phases since 2018 and are achieving the goal of providing 100-year flood protection to residences within the development and surrounding area.
More